Case study
- Role
- Sole developer
- Organisation
- Personal project
The Contour Atlas
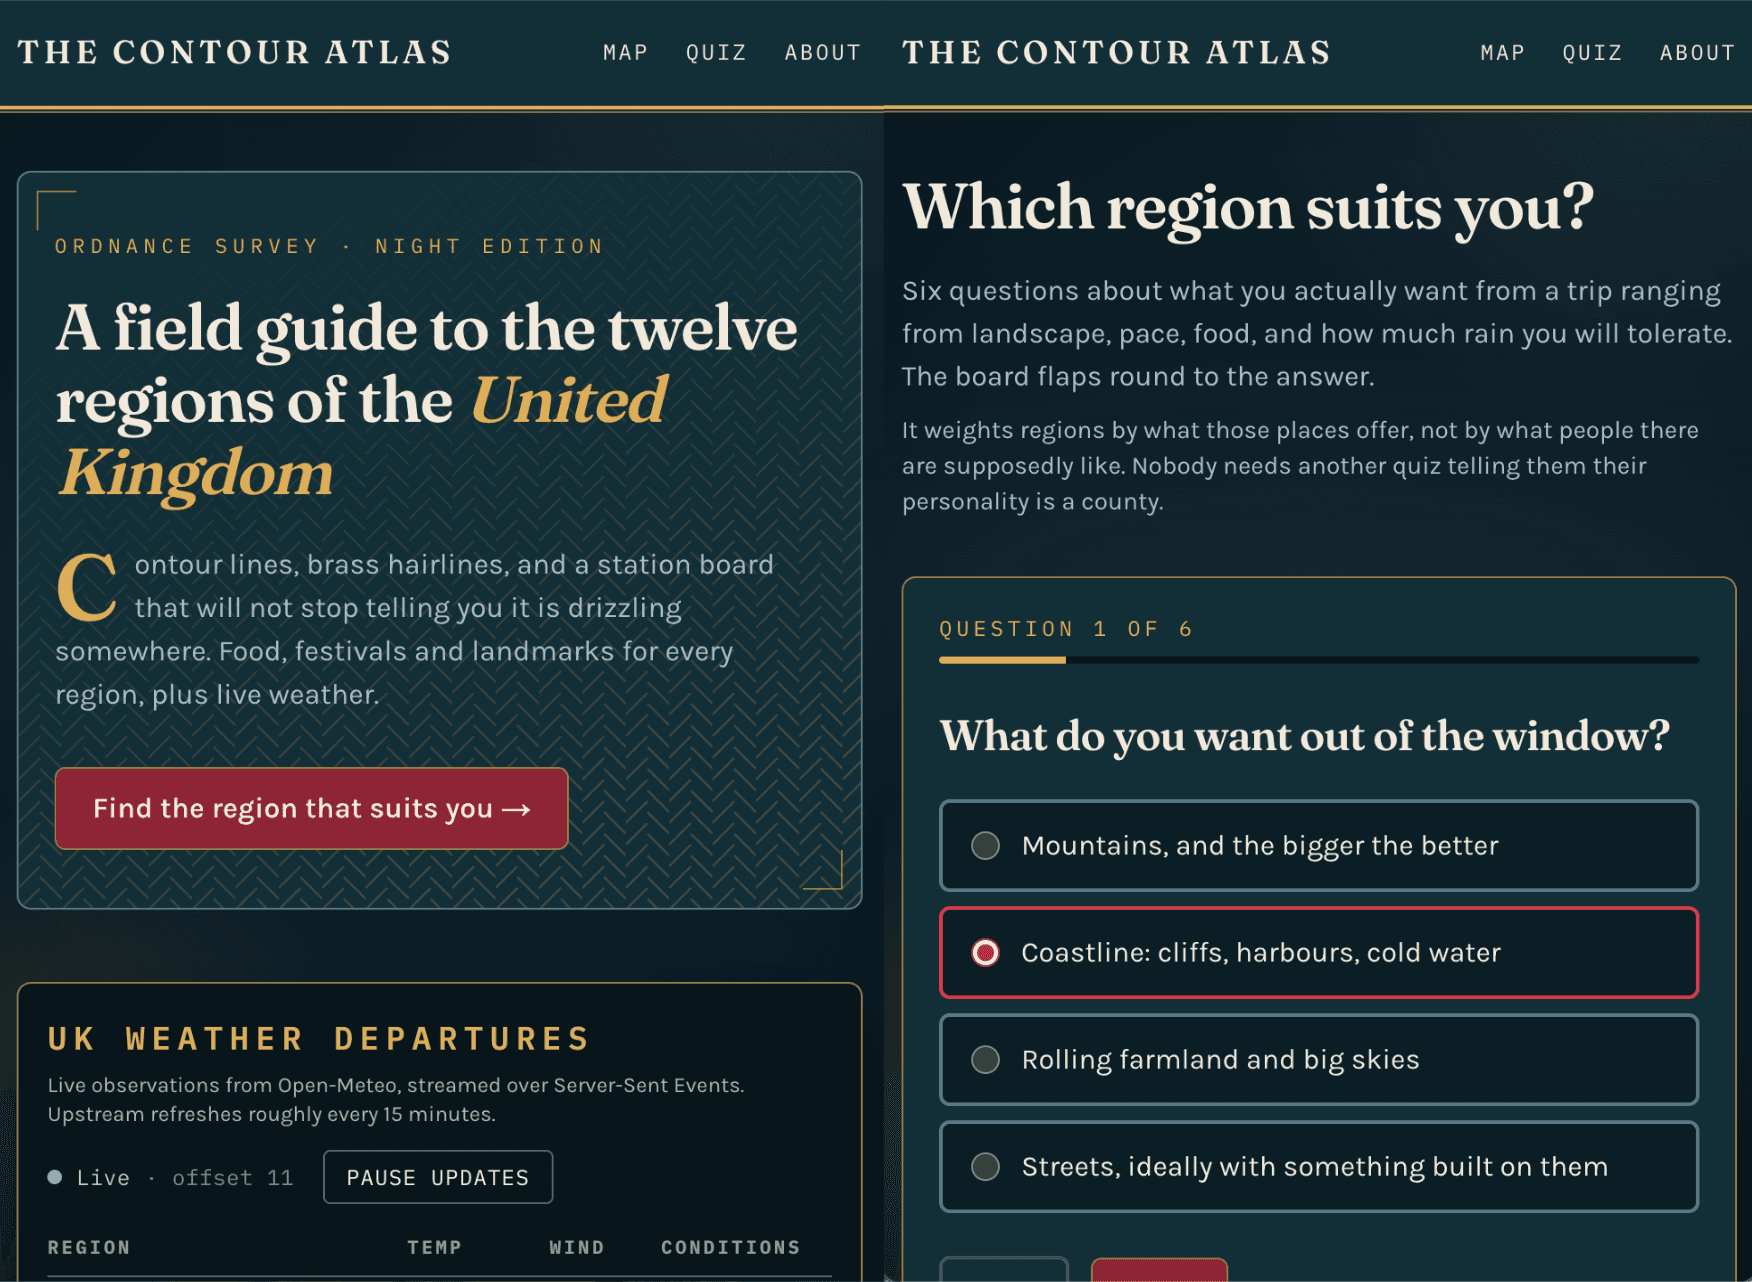
A field guide to the twelve regions of the UK, covering food, festivals, landmarks and live weather, drawn as an Ordnance Survey sheet. Live readings arrive on a station-style split-flap board that only flips when something has actually changed.
01 / Overview
What I did.
Built to get streaming right at small scale: a real producer, a real change filter, a real transport, and an abstraction thin enough that the streaming layer could be swapped for a broker without touching the application. It also runs entirely without an API key, which was a constraint I set deliberately: the design had to survive a free, rate-limited upstream.
02 / Architecture
Layers listed outermost first.
How it's put together.
A producer-consumer pipeline with three deliberate seams: one between the upstream API and the producer, one between the producer and the transport, and one between raw coordinates and anything drawn on screen. Each seam exists because that is where I expected the implementation to change.
Upstream
Where the weather comes from.
Open-Meteo, queried without an API key. All twelve regions are fetched in a single request rather than twelve, which is what keeps the whole thing inside a free tier at a 60-second cadence.
Producer
One poller for the whole map.
A server-side loop polling once every 60 seconds. It runs on the server, not in each visitor's browser, so a hundred concurrent visitors cost exactly the same upstream traffic as one.
Change filter
Only publish news.
Each reading is compared with the last published value for that region and dropped if it has not moved. The board flips because something changed, not because a minute passed.
Event bus
The seam a broker would slot into.
Publishing goes through an EventBus interface with an in-process implementation. Moving to a Kafka-compatible broker means writing one more implementation of that interface, not reworking the application around it.
Transport
Server to browser.
Server-Sent Events. Changed readings are pushed down an open HTTP response as they are published; the browser's EventSource handles reconnection itself.
Client
The sheet and the board.
React components rendering the map and the split-flap board, subscribed to the event stream and animating only the characters that actually differ.
Projection
One coordinate system for everything drawn.
Coastline, regional borders and location pins all pass through the same coordinate-to-SVG function, so a pin cannot land in the sea because two pieces of geometry disagreed.
03 / Decisions
Each of these had a credible alternative. The trade-off is stated, not hidden.
Choices, and what they cost.
Server-Sent Events, not WebSocket
- Chose
- SSE over a long-lived HTTP response
- Instead of
- WebSocket
- Client-side polling on an interval
- Why
- The data only ever travels one way, server to browser. WebSocket buys a return channel this application has no use for, in exchange for a protocol upgrade, its own reconnection logic and more hostile behaviour through proxies. SSE is plain HTTP, and EventSource reconnects on its own with no code from me.
- Trade-off
- There is no client-to-server channel, so anything interactive later would need a separate mechanism. Browsers also cap concurrent SSE connections per origin, which is fine for one stream and would not be for many.
One batched upstream poll, server-side
- Chose
- A single server-side request covering all twelve regions every 60 seconds
- Instead of
- One request per region
- Each browser fetching the weather itself
- Why
- Twelve requests a minute per visitor would have needed a paid key almost immediately; one request a minute for everybody does not. Polling on the server also decouples upstream cost from traffic entirely, since the load is the same whether one person is watching or a thousand.
- Trade-off
- A single request is a single point of failure: one bad response affects all twelve regions at once, so the failure has to degrade to stale-but-labelled data rather than an empty map.
Filtering unchanged readings at the producer
- Chose
- Comparing against the last published value and publishing only differences
- Instead of
- Publishing every reading on every tick
- Letting the client decide what changed
- Why
- A split-flap board that flips every 60 seconds regardless is noise, and it trains you to ignore it. Filtering at the producer means every animation on screen carries information, and it keeps the stream quiet, so a change is visible in the network tab as well as on the board.
- Trade-off
- Silence becomes ambiguous: a client cannot tell 'nothing changed' from 'the producer died'. That needs a heartbeat to resolve, which is a cost the naive approach does not have.
An EventBus interface over calling a broker directly
- Chose
- An interface with a single in-process implementation
- Instead of
- Publishing straight to the transport
- Running Kafka or Redpanda from the start
- Why
- A broker in Docker for a twelve-region weather feed would be infrastructure with nothing to justify it, and it would put a container between me and every deployment. The interface costs almost nothing and means the decision stays open: if this needed durability or multiple consumers, it is one new implementation rather than a rewrite.
- Trade-off
- It is an abstraction with exactly one implementation today, which is the classic shape of speculative generality. It earns its place only because it is genuinely thin: a handful of methods, no configuration, no framework.
A single shared projection function
- Chose
- One coordinate-to-SVG transform used by coastline, borders and pins
- Instead of
- Per-feature coordinate handling
- Pre-baked SVG paths with hard-coded pin positions
- Why
- The failure mode of drawing geography is quiet: a pin two pixels into the sea, a border that does not meet the coast. Those happen when two pieces of code convert coordinates slightly differently. Routing everything through one function makes registration structural, because the features cannot disagree, because there is only one conversion.
- Trade-off
- Everything now depends on that one function being right, and changing the projection changes every drawn element at once. That is the intended property, but it means the function needs the most care in the codebase.
04 / Stack
Grouped by the job they do rather than listed as a keyword run.
Technologies.
- Application
- Styling
- Streaming
- Data
- Drawing
- Hosting
05 / Outcome
Where it landed.
A live streaming pipeline with no key, no broker and no per-visitor upstream cost. The two things I set out to prove both held up: that a change filter makes an interface calmer and more informative at the same time, and that one seam in the right place keeps a decision open.